Antibody Drug Evaluation & Testing
Multi-parameter, high-throughput single-cell analysis of surface and intracellular expression, functional state and heterogeneity.
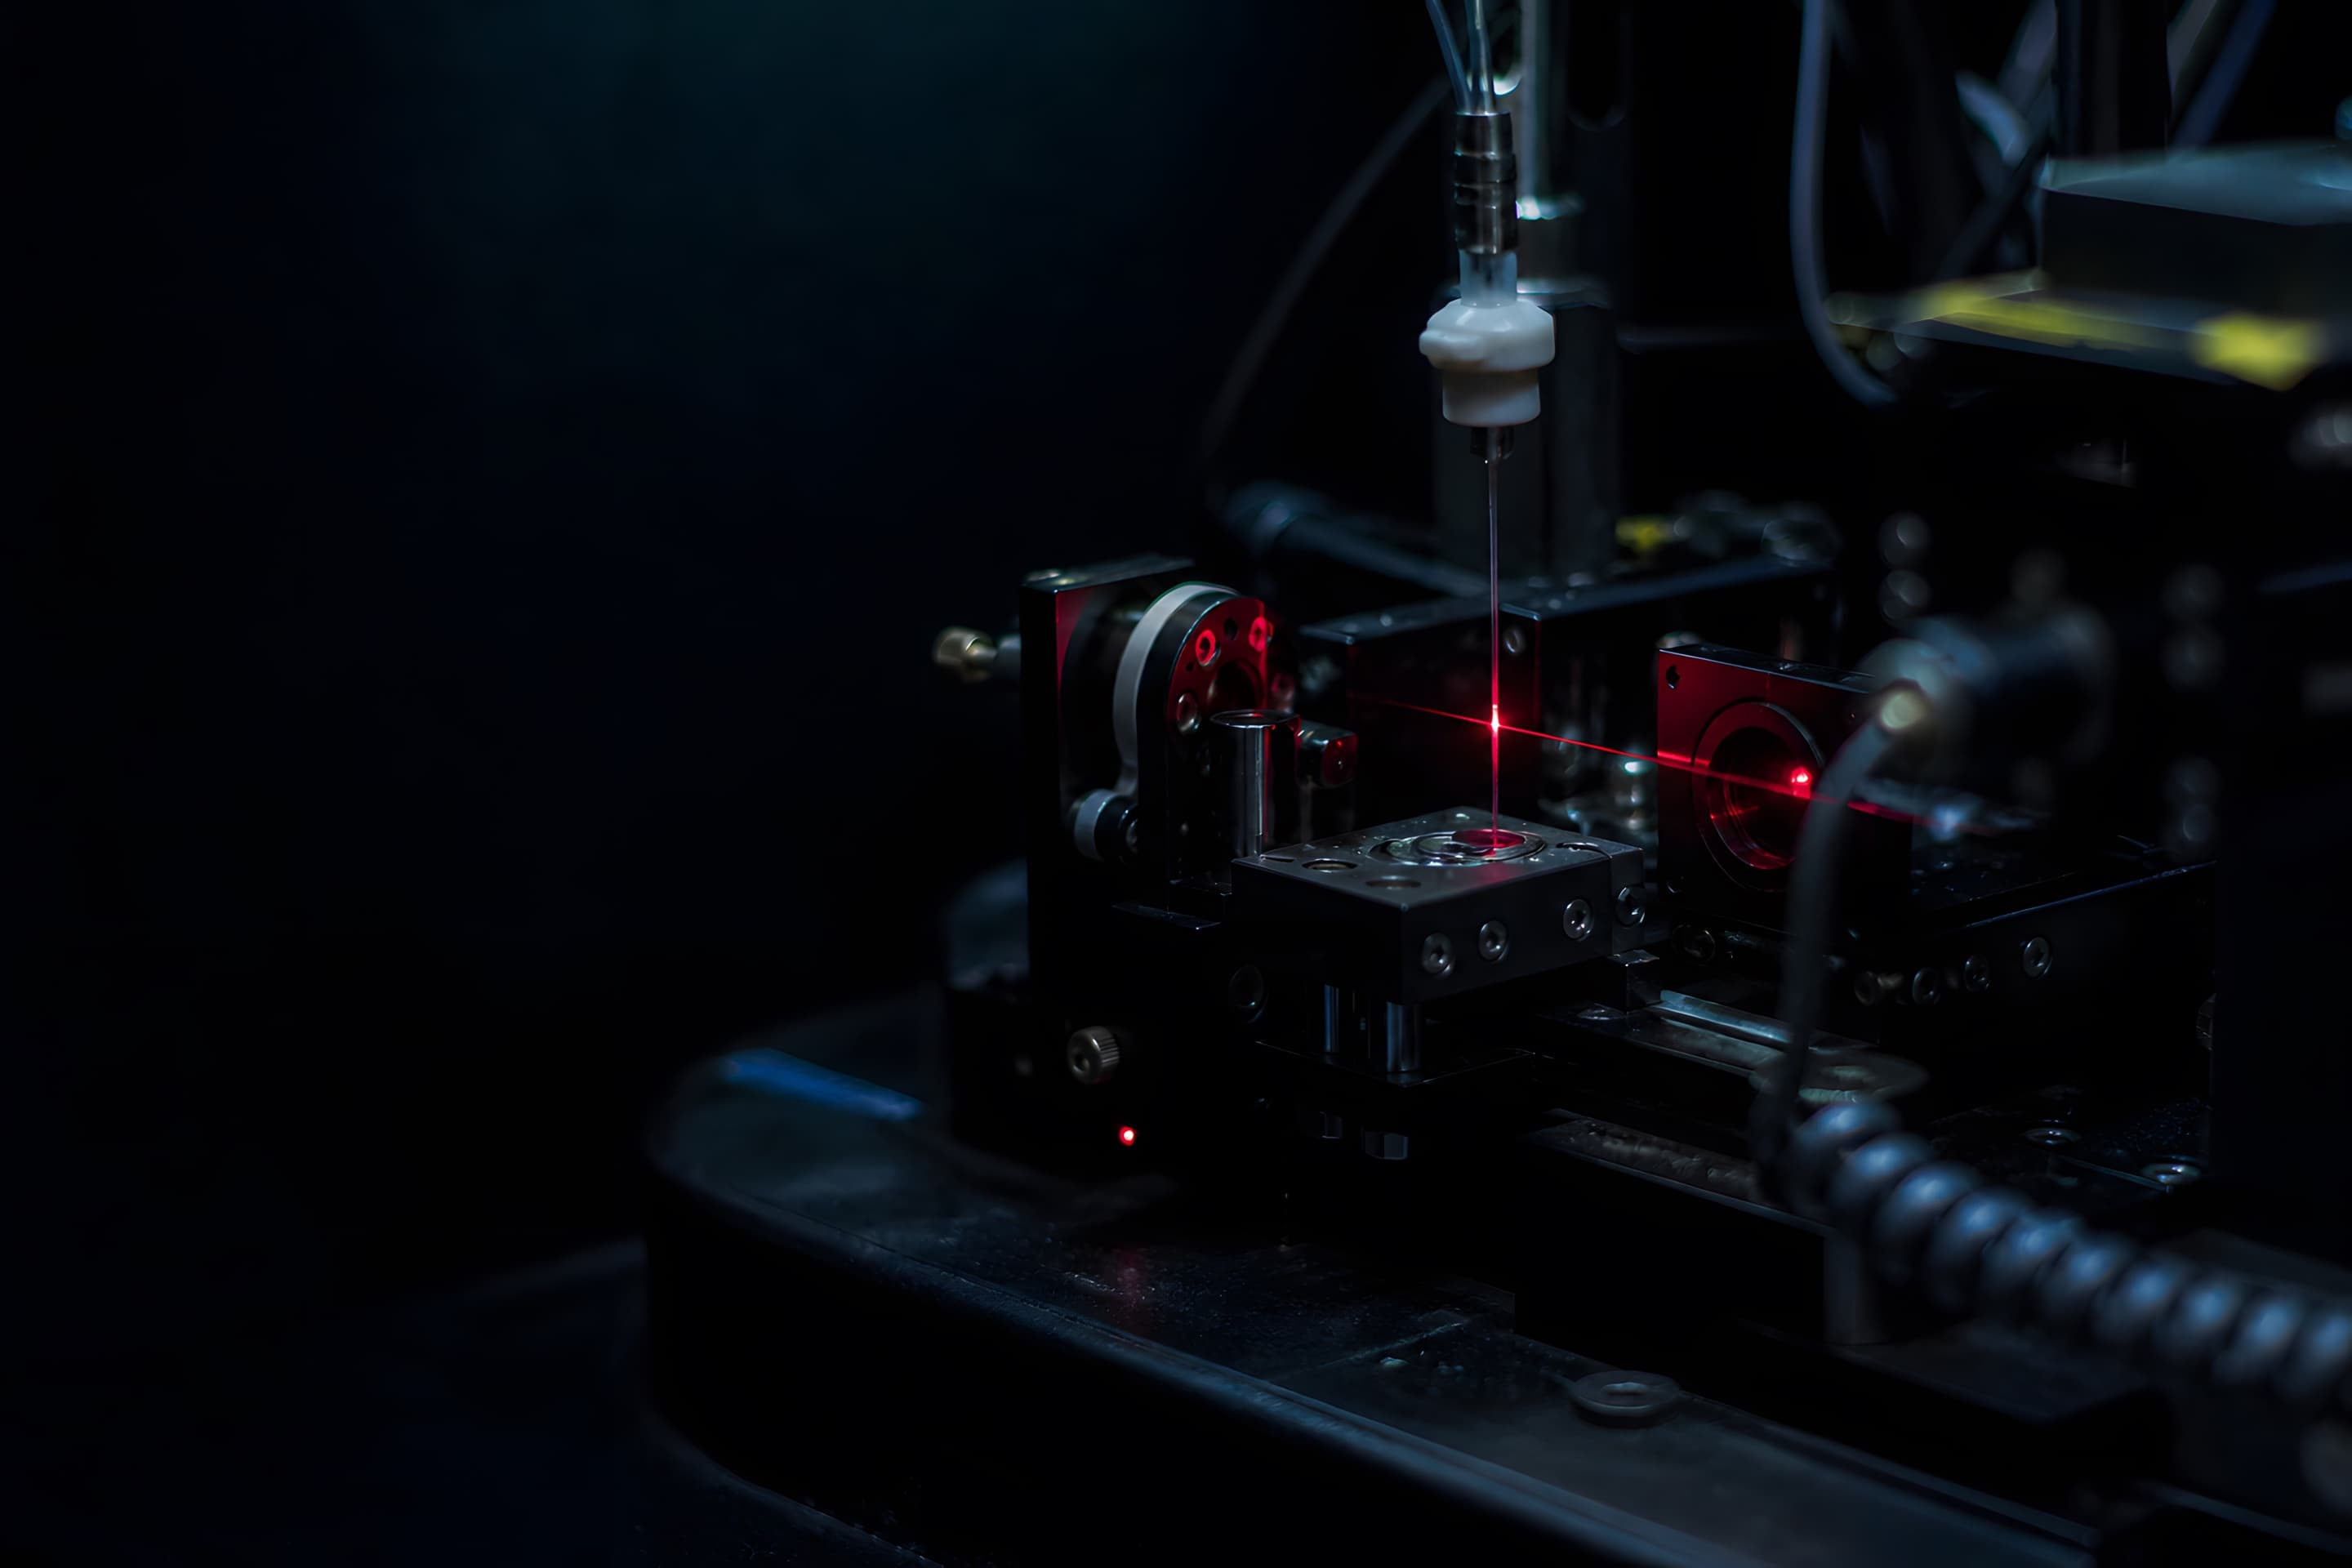
Our flow cytometry service analyses cells or beads across many parameters at high throughput, assessing surface and intracellular expression, functional state and heterogeneity at single-cell resolution — widely applied in immunology, oncology and cell therapy research.
High-end instruments and an experienced team handle complex samples and fine-grained phenotyping. Basic analysis reports subpopulation percentages and mean fluorescence intensity; deeper analysis adds dimensionality reduction, clustering and functional-state profiling.
The workflow and timeline are clearly defined and can flex to specific needs, covering study design, execution and in-depth data analysis in one service.
Enquire now →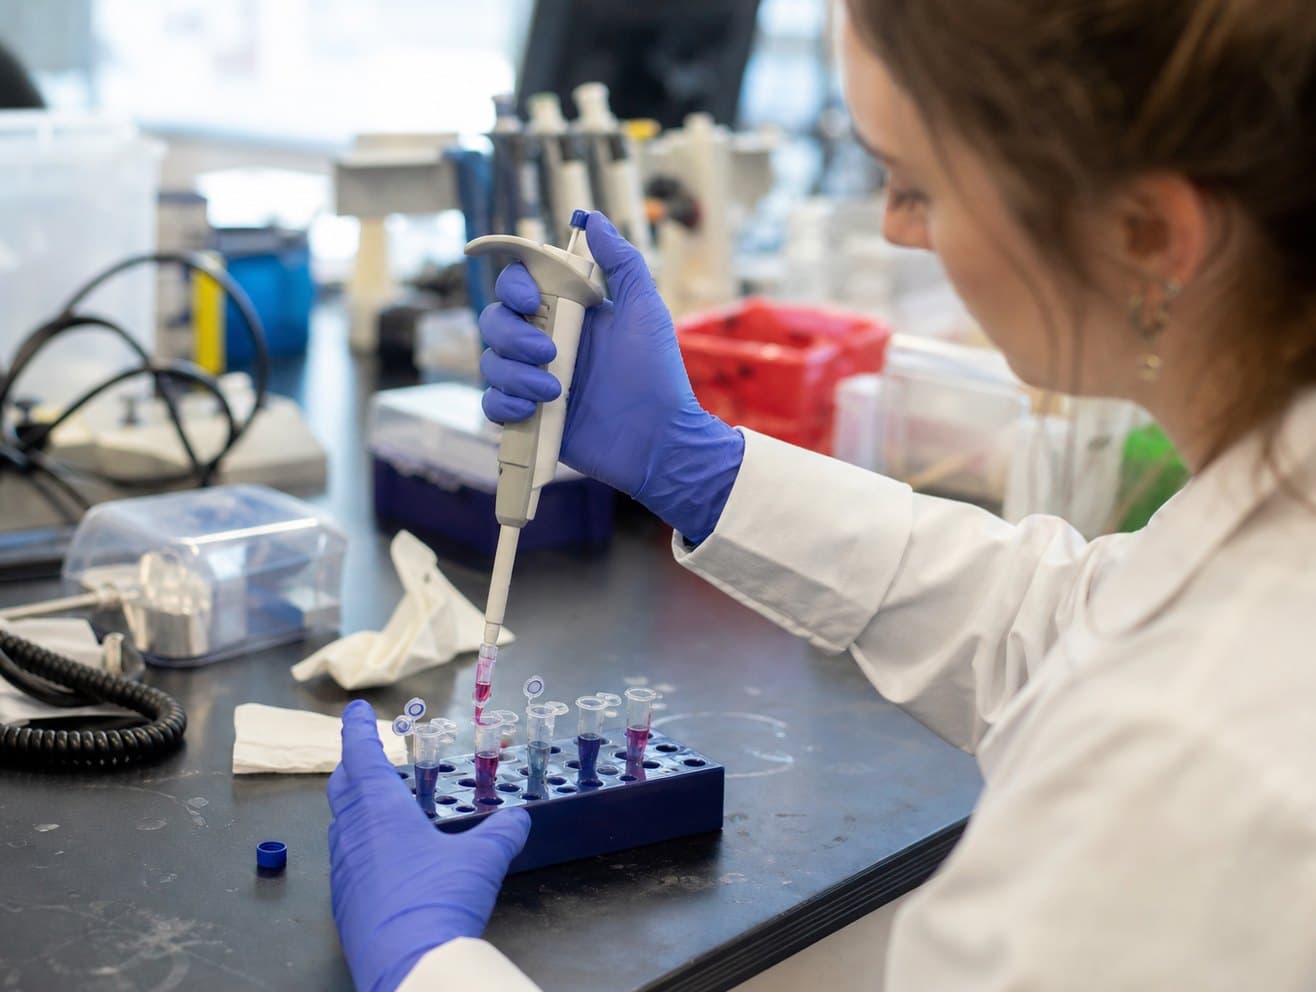

One-stop coverage from study design and bench work through in-depth data analysis.
High-end instruments and a specialist team handle complex samples and fine-grained phenotyping.
Beyond basic readouts, we mine high-dimensional data and interpret it biologically for your programme.
Clear workflow and defined timelines, with the plan adjusted to your requirements.

Five stages. The multicolour panel is validated for spectral overlap before running, and any deeper analysis dimensions are agreed in advance; outputs and acceptance criteria are in the specifications below.

The multicolour panel is designed and optimised, with sample handling, staining and controls defined
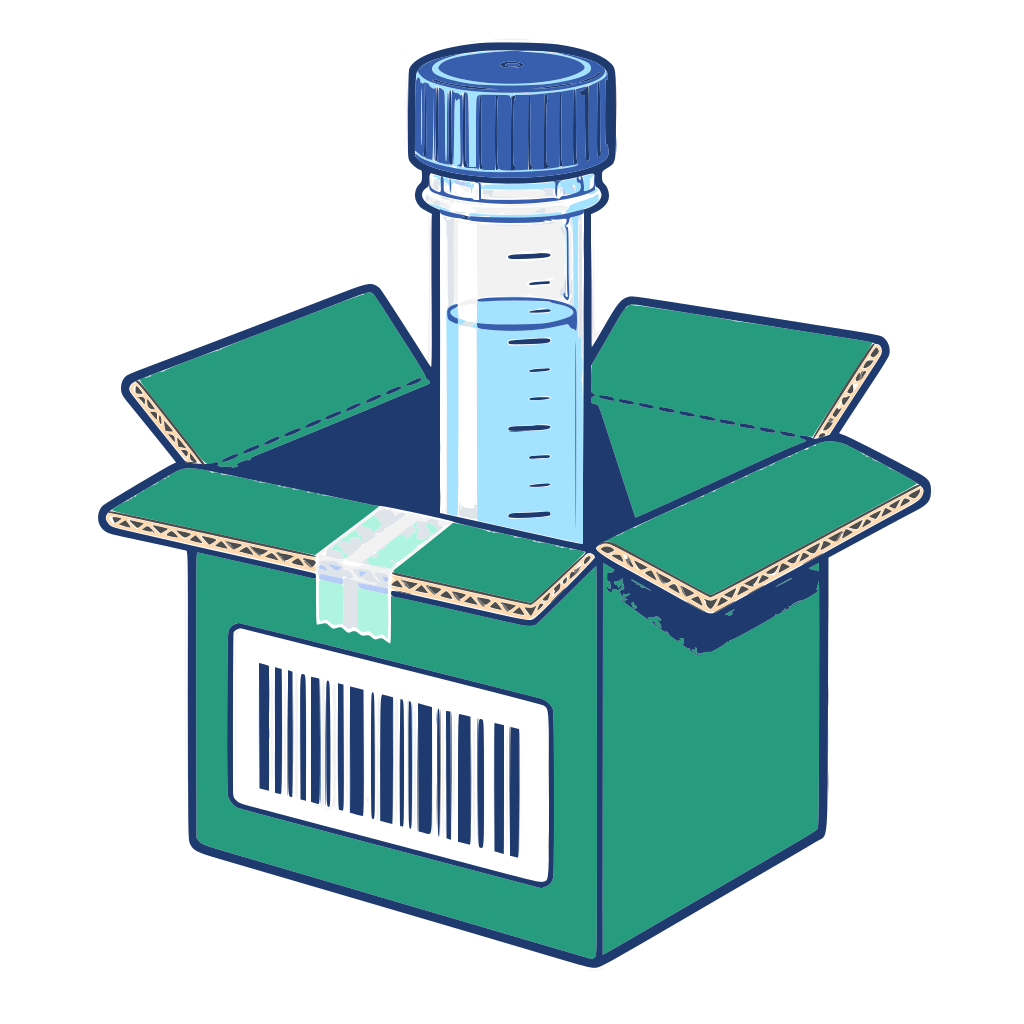
Samples are received and activated or cultured as needed, then surface/intracellular stained, fixed and permeabilised
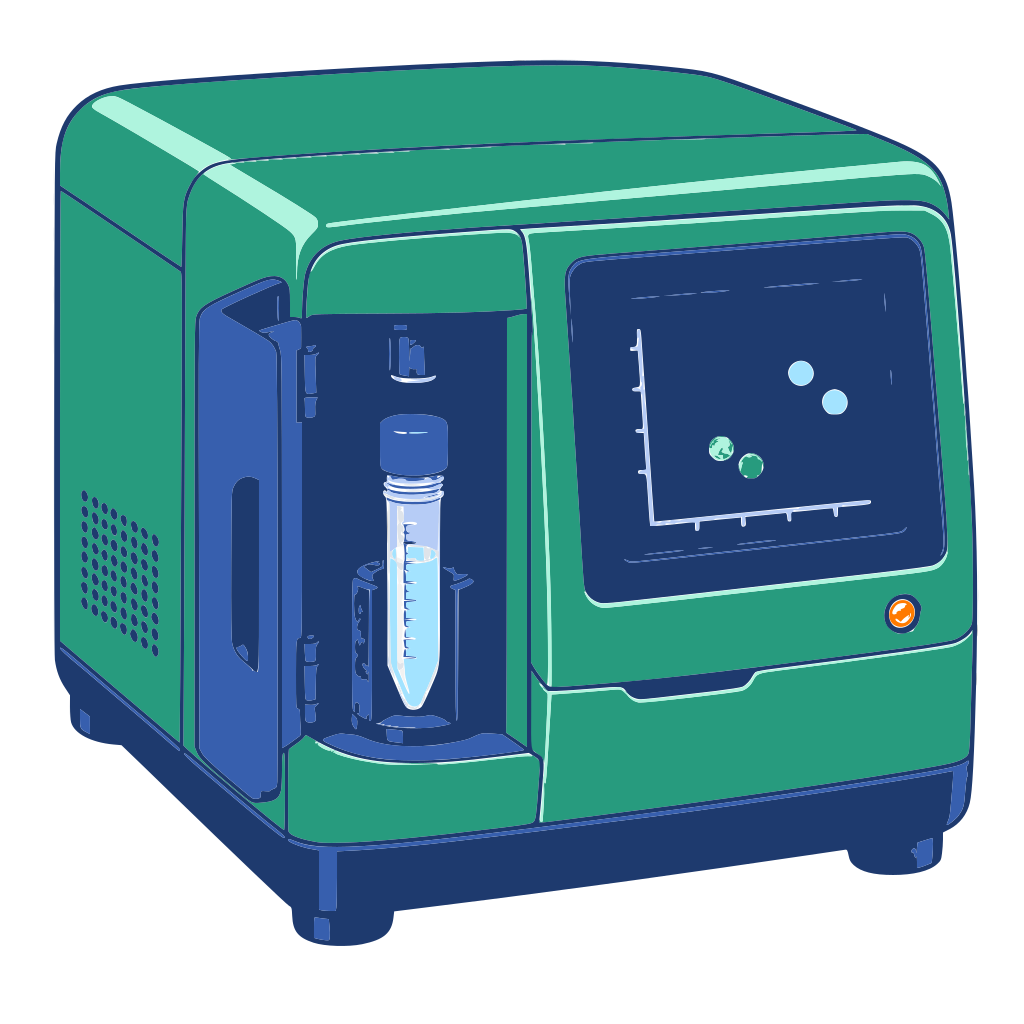
The cytometer is calibrated, QC beads run, and data acquired with signal quality monitored live

Gating yields subpopulation percentages and mean fluorescence intensity, with optional dimensionality reduction and clustering
The full gating strategy, statistical charts, conclusions and interpretation are delivered, with editable figures optional
Design and confirmation 1–2, sample processing and staining 1–2, acquisition with QC 2–3, and analysis with reporting 1 — roughly 5–8 working days.
Basic analysis reports subpopulation percentages and mean fluorescence intensity; deeper analysis adds dimensionality reduction, clustering and functional-state profiling, going past raw numbers to a tailored biological interpretation — backed by high-end instruments and a team experienced in complex samples and fine-grained phenotyping.
Deliverables, acceptance criteria and timelines by experimental stage (source omits the time unit). The staging differs from the process above: the process shows how a project runs, while this table is the acceptance basis written into the contract.
| Stage | Scope | Deliverables | Standards | Timeline |
|---|---|---|---|---|
| Design & confirmation | Objectives are agreed, a multicolour antibody panel designed and optimised, and sample handling, staining workflow and controls defined. | 1. Confirmed study protocol 2. Panel design with compensation reference | The design is scientifically sound and answers your question clearly; the panel is validated for spectral overlap. | 1-2 |
| Sample handling & staining | Samples (cells, tissue and so on) are received and activated or cultured as needed, then stained on surface or intracellular targets with fixation and permeabilisation as required. | 1. Sample handling records 2. Prepared samples ready in acquisition tubes | Post-processing viability is typically >90%, staining background is low and positive signal distinct, with full negative and isotype controls in place. | 1-2 |
| Acquisition & QC | The cytometer is started and calibrated, QC beads are run, and data are acquired to protocol with signal quality monitored live. | 1. Raw data files for every sample (standard .fcs) 2. Instrument QC report | Instrument performance passes QC and each sample acquires enough events for statistics (typically ≥10,000 target cells). | 1 |
| Analysis & reporting | Standard analysis: gating with subset percentages and mean fluorescence intensity. Optional deeper analysis: high-dimensional reduction, clustering and functional state analysis. | Standard report covering: 1. Full gating strategy 2. Statistics per population (proportion, MFI) 3. Conclusions and interpretation 4. Editable figure files (optional) | Gating logic is clear and consistent, presentation accurate and conclusions tied to the objective; deeper analysis requires the dimensions to be agreed in advance. | 2-3 |
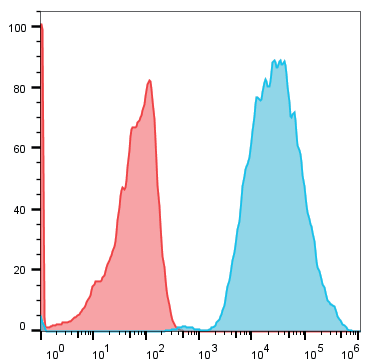
In the stable line, the positive population separates clearly from the negative control.
Share the intended application and what you already have in hand. A scientist — not a sales rep — will scope feasibility, suggest the right route and send a quote, usually within one business day.